NOTE: All stats as at 0900NZT, 03-08-2015
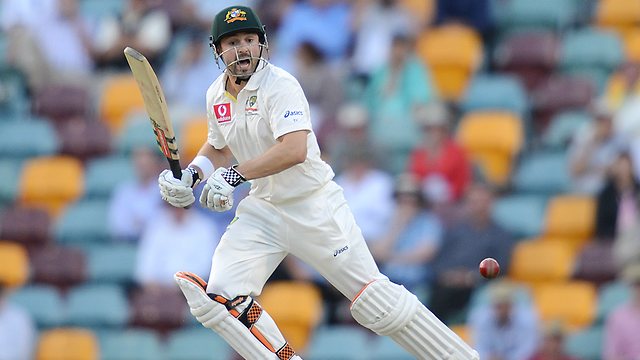
This inspiration for this piece came from a fellow Mind the Windows! writer, Dan McGrath. His suggestion was to look at the primary task of opening batsmen – that is, seeing the shine off the ball. While those with the characteristics of David Warner or Virender Sehwag have taken the cricketing world’s attention in recent years, Dan’s wanted to know who lasts the longest.
A few riders must be added into this – it is by no means a judgement of who the best opening batsman is, a fact best displayed by how low David Warner is ranked. It’s also only looking at the time period since the beginning of 2010.
The first issue was to look at who makes a cut-off requirement. I decided that 15 Tests as opener, since January 1st 2010, was the best way of only looking at openers who have had a decent spell in the role.
It does omit names such as Peter Fulton (13 Tests), Shikhar Dhawan (14 Tests), Dean Elgar (9 Tests), Tom Latham (10 Tests), and Nick Compton (8 Tests), among others. A few of those names, I concede, did surprise me (for example, I expected Dhawan to have easily qualified for the shortlist).
A total of 25 names made the shortlist. Kraigg Brathwaite, Alistair Cook, Ed Cowan, Tilikaratne Dilshan, Gautam Gambhir, Chris Gayle, Martin Guptill, Imrul Kayes, Dimuth Karunaratne, Brendon McCullum, Mohammad Hafeez, Tharanga Paranavitana, Alviro Petersen, Kieron Powell, Chris Rogers, Hamish Rutherford, Virender Sehwag, Kaushal Silva, Graeme Smith, Andrew Strauss, Tamim Iqbal, Taufeeq Umar, Murali Vijay, David Warner and Shane Watson.
From there, I had to look at the immediate requirements of the task Dan had set me. To, I’m sure, the relief of both of us, the man who this task was named after (Ed Cowan) made the grade. (‘The Cowan’, I was advised, was something of a loose faux-measurement used to judge openers who saw the shine off the ball.)
I looked at the prescient issues. It was about facing deliveries – balls faced per innings, balls faced per dismissal, the median for balls faced, and the percentage of innings where 50+ or 100+ balls were faced were what I decided to measure.
Then came the fun (please note the sarcasm) chore of calculating all this. It threw up some surprising results immediately (see figure 1).
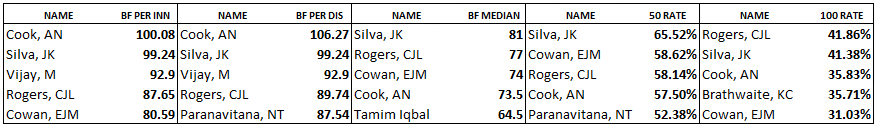
Two things are very immediately apparent. Kaushal Silva, despite the slow start to his career, and despite his average as an opener only hovering a shade above 40, never drops below second in any of these measurements.
Equally, the much-maligned Alistair Cook, despite his alleged awful form ever since the 2010/11 Ashes, has averaged 48.90 with the bat, and never dropped out of the top four in any of these measurements.
But what do all these numbers mean? How can I turn Chris Rogers’ 41.86% 100-ball rate into an objective measurement? How does that relate to his balls faced per innings, per dismissal, or the median mark he’s achieved?
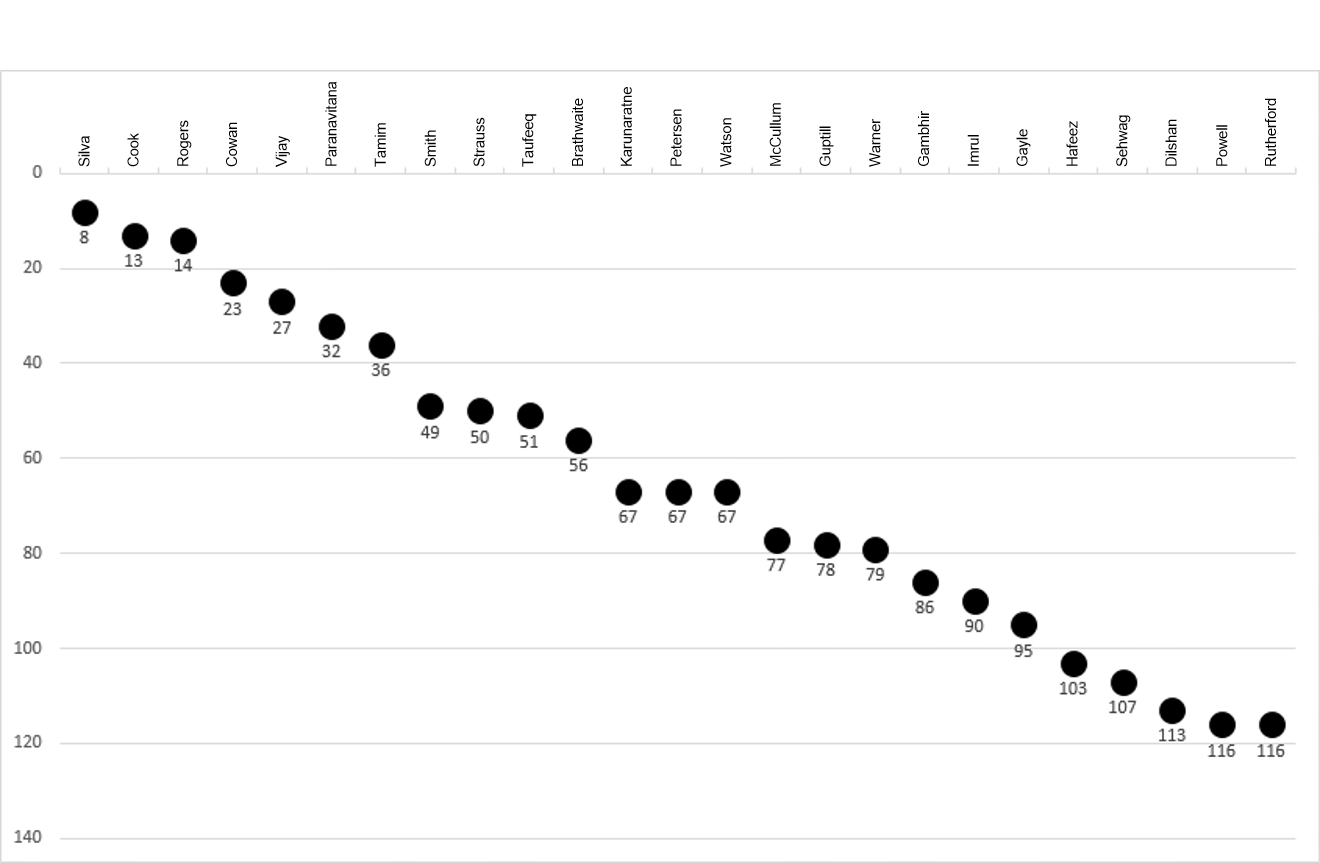
The easy – and lazy – way is to simply measure all the tallies, and see where they rank. With 25 names on the shortlist, each can be ranked from one to 25 in each regard, with those ranks counted up and the lowest score winning (see figure 2).

Of those, Alistair Cook is to be expected. His proficiency for mammoth scores has been tainted but not entirely rubbished by his recent poor form. Chris Rogers has been the quiet achiever to David Warner’s brazen assaults on opposition bowlers. Ed Cowan was always more valuable than his average suggested. Murali Vijay has been top-rate.
The only real surprise is Kaushal Silva, who I don’t think too many would have predicted. In his 29 innings as an opener, he’s made two centuries and eight other 50+ scores. His average of 40.83 isn’t Bradmanesque, but his achievement of reaching 50 balls-faced in almost two-thirds of his Test innings is something to be proud of.
The bottom five is also worth noting – Hamish Rutherford appears last, which won’t surprise the majority of cricket watchers. Kieron Powell is equal with Rutherford at the bottom – again, given his sub-30 average, unsurprising.
Next up is Tilikaratne Dilshan, followed by Virender Sehwag. The former has averaged 38, the latter 42, under the requirements concerned, but their fast scoring means their positions are surprising but not mind-boggling. Fifth to last is Mohammad Hafeez, suffering predominantly because his 50-rate and median are so poor.
Using the same numbers, but looking at them in a more accurate way, would be to view these players on a continuum. As can be seen, Silva is five rating points ahead of second place, while Cook is just one rating point ahead of third – despite this, the difference between first and second, and second and third, appears identical.
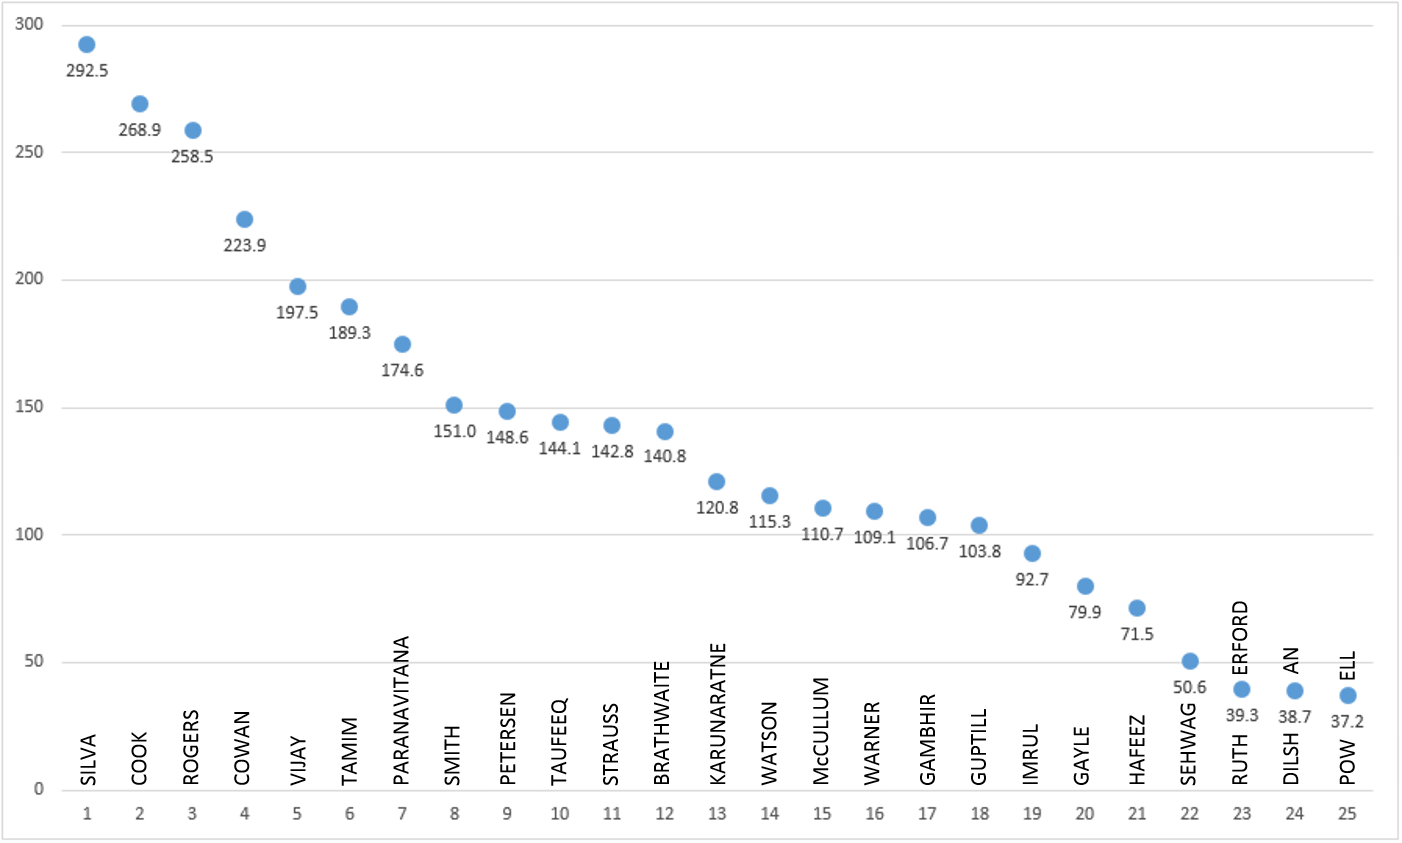
So here it is graphed out, to show the true difference between each batsman (see figure 3).
As we can see, there are immediately clear divisions – from Kaushal to Tamim Iqbal, from Graeme Smith to David Warner, and from Gambhir onwards.
It gives us a more overall view – but then means we have another question to answer. Is this the most accurate and reflective analysis of the numbers we uncovered?
I decided to analyse them further. Ranking points gives the same faux-measurement as we had before – for each of those five measurements, the difference between first and second might be huge, whilst the difference between second and third miniscule. But it’s not recorded.
So I started by basing each of these figures; the lowest figure now became zero, the highest 100, and each player thus receiving a ‘score’ out of 100.
As an example, this meant that Kaushal Silva had ratings of 2, 2, 1, 1 and 2 compared to Cook’s 1, 1, 4, 4 and 3.
Taking just the first two ratings (one and one vs two and two), immediately we see a more realistic difference. Cook’s rankings (the two ‘1’ rankings change to 100 and 100 instead) are contrasted by Silva’s ratings of 98.4 and 87.9.
But I also condensed figures – I only attributed a value of 0.5 to balls faced per innings, and per dismissal. Median retained a 1.0 value, while the 50 and 100 rates each had a value of 0.5.
It meant that instead of being out of a possible 500, it became out of a possible 300.
Surprisingly, nothing changed. The top five, and their order, remained the same. Numbers six and seven changed places, while the only big mover was Alviro Petersen, who moved up three places to ninth.
So here’s our ‘The Cowan’ hall of fame – the top ten shine-seekers since the beginning of 2010. For those interested in the graphic progression across the 25, see the final image below (see Figure 4).
THE COWAN
Kaushal SILVA (292.4604)
Alistair COOK (268.9458)
Chris ROGERS (258.5026)
Ed COWAN (223.8608)
Murali VIJAY (197.4911)
TAMIM IQBAL (189.3403)
Tharanga PARANAVITANA (174.6229)
Graeme SMITH (151.0194)
Alviro PETERSEN (148.5867)
TAUFEEQ UMAR (144.1157)

The “Cowan” is one’s ability to churn out a scratchy 30 time after time.
LikeLike